Analyzing Execution Traces with Hollistic Trace Analysis
Published
Going from PyTorch traces to a visual representation of the execution of your program. Includes resources for further exploration.
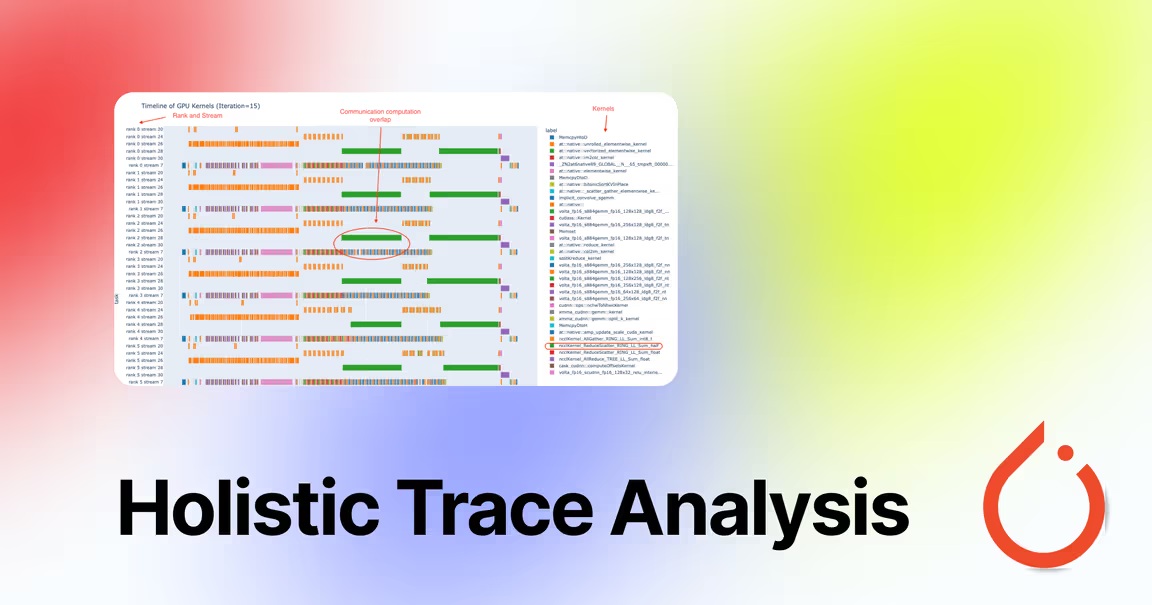
Hollistic Trace Analysis (HTA)
HollisticTraceAnalysis (HTA) is a library which provides a set of tools for analyzing PyTorch traces. It is designed to be a “pythonic” was of analyzing traces without the need for closed source tools such as NVIDIA NSIGHT Compute.
pip install HolisticTraceAnalysisHTA supports multiple objects for analysis. Consequently, each file must contain a rank key such that HTA can know the location of a device. Without a rank, you recieve the following (rather cyptic error):
2024-02-23 20:37:50,287 - hta - trace.py:L389 - INFO - traces
2024-02-23 20:37:50,290 - hta - trace_file.py:L61 - ERROR - If the trace file does not have the rank specified in it, then add the following snippet key to the json files to use HTA; "distributedInfo": {"rank": 0}. If there are multiple traces files, then each file should have a unique rank value.
2024-02-23 20:37:50,291 - hta - trace_file.py:L92 - WARNING - There is no item in the rank to trace file map.
2024-02-23 20:37:50,291 - hta - trace.py:L535 - INFO - ranks=[]
2024-02-23 20:37:50,292 - hta - trace.py:L541 - ERROR - The list of ranks to be parsed is empty.
Not to be detered, we may createa a TraceAnalysis object with the following to represent traces collected:
from hta.trace_analysis import TraceAnalysis
from glob import glob
import json

for trace in glob("traces/*.json"):
  with open(trace, 'r') as f:
    trace_obj = json.load(f)
    trace_obj['rank'] = 0

  with open(trace, 'w') as f:
    json.dump(trace_obj, f)

analyzer = TraceAnalysis(trace_dir="traces") # this should be different
After setting up your analyzer object, you are then able to use HTA exactly as described by the HTA documenation. For instance, you could get statistics about CUDA kernel launches using the following:
kernel_info_df = analyzer.get_cuda_kernel_launch_stats()
kernel_info_df # displays a graph in matplotlibs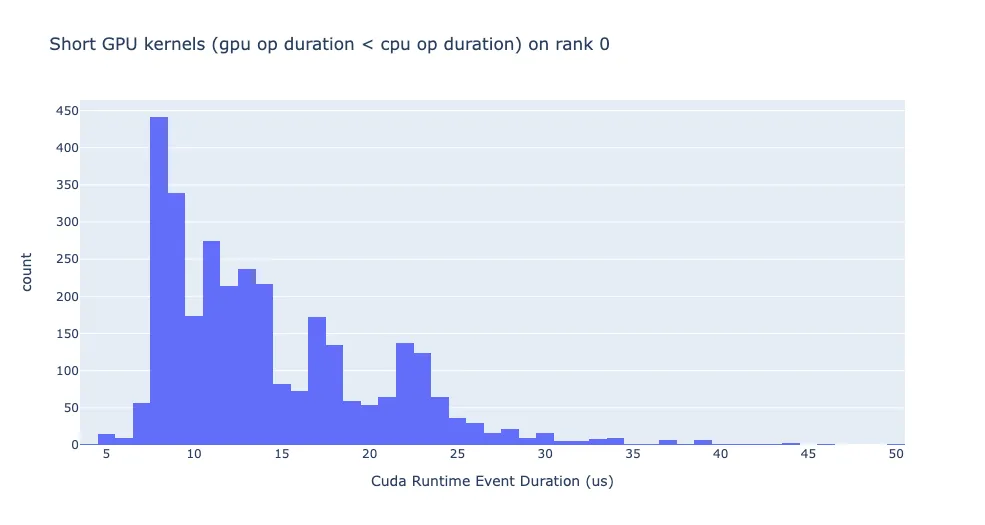
GitHub Copilot best quality is making programmers langauge agnostic
Stay in touch
Subscribe to my RSS feed to stay updated
Have any questions
Feel free to contact me! I will answer any and all inquires